Explainer · Health and function
Why “frailty” can mean different things in different studies
Physical features, accumulated deficits and performance tasks measure different inputs. Learn what a changed frailty score can and cannot establish.
Evidence scope
Human measurement methods, not treatment evidence
- Study type
- Historical human observational validation; supplementary consensus and molecular-model context
- Studied in
- Older adults in three separate core cohorts; populations are not pooled
- Outcome type
- Measurement inputs, physical function and prognostic associations
- Evidence maturity
- Peer-reviewed methods; prediction alone does not validate treatment-induced changes as a lifespan surrogate
- Publication status
- Three core historical reports; EWGSOP2 and Horvath context have linked corrections
- Reporting confidence
- Source-mapped reporting; separate from evidence maturity and treatment efficacy
- Development stage
- Measurement explainer; no intervention approval or efficacy claim
- Funding and conflicts
- Historical funding, commercial relationships and patent disclosure are detailed below
The result depends on the ruler
A study reports that a frailty score improved. Before deciding what that means, ask what went into the score. A physical phenotype, a fraction of accumulated health problems and a battery of movement tasks can all appear in frailty research. They do not collect identical information, and a change in one does not automatically establish a change in the others. [1] [2] [3]
That distinction matters when reading small intervention studies, including this site’s pectin-pilot reporting. The useful question is more specific than whether a number moved: which measure changed, in which participants, compared with what, and over what period? Historical studies linking measurements with later outcomes help explain why researchers use these tools. Those associations alone do not show that making a score lower through treatment extends life. [1] [2] [3]
Evidence at a glance
This is a methodological explainer, drawing principally on three peer-reviewed human observational reports. Fried's 2001 analysis included 5,317 adults aged 65 or older. Searle's 2008 methods paper used a cohort of 754 community-dwelling, non-disabled adults aged 70 or older, with 681 attending follow-up. Guralnik's 1994 assessment cohort comprised 5,174 selected home-living personal respondents aged 71 or older; individual tasks had different denominators. These samples are separate, not one pooled validation population. [1] [2] [3]
The evidence concerns measurement and prognostic associations. It is not a trial establishing a longevity treatment. Supplementary sarcopenia consensus and molecular-model context have published corrections, identified below. Confidence in accurately describing a method is separate from evidence that changing its score produces a health benefit. [1] [2] [3] [4] [5]
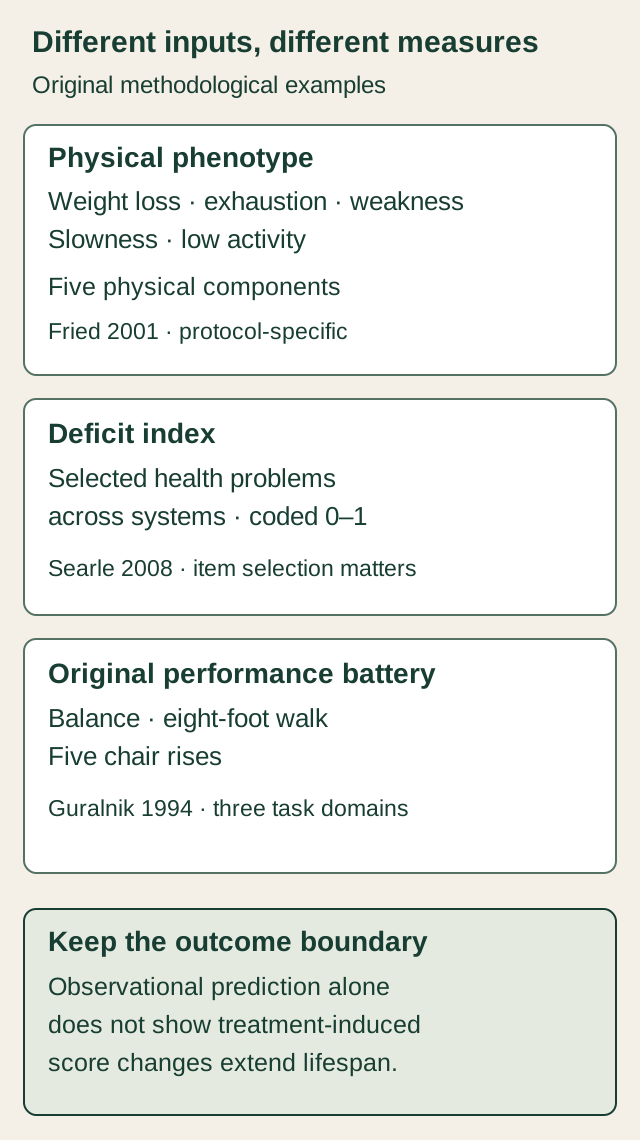
Three separate measurement lanes: five physical components (weight loss, exhaustion, weakness, slowness, low activity) form Fried's physical phenotype; selected health deficits across systems form a deficit index; balance, an eight-foot walk and five chair rises form Guralnik's original performance battery. Single grip/walking tasks are not these complete instruments. A separate outcome boundary states that observational prediction does not by itself establish that treatment-induced changes extend lifespan. No lane converts into another or points to a longevity benefit. [1] [2] [3]
One approach starts with five physical features
Fried and colleagues operationalized a physical phenotype using weight loss, exhaustion, weakness, slowness and low physical activity. This is a specified research construction, rather than a synonym for every health problem someone might have. [1]
Even the apparently straightforward tasks need their instructions. In the original report, grip and walking components used specified protocols and participant characteristics; the walking assessment covered 15 feet. A paper using another distance or implementation needs its own methods checked. This explainer deliberately omits clinical cutoffs rather than turning the original research into a home classification guide. [1]
Missing measurements also deserve attention. Fried's evaluability rule required at least three nonmissing components. An unrecorded component cannot simply be read as an absent problem. When comparing reports, look for how many participants could actually be evaluated and how the authors handled unavailable inputs. [1] [2] [3]
Another approach counts accumulated deficits
Searle and colleagues describe selecting health deficits across systems and coding them on a zero-to-one scale, sometimes with intermediate values. Their worked construction used 40 items. It is broader than a five-component physical phenotype, but it is not permission to assemble an arbitrary checklist. [2]
For arithmetic illustration only, imagine a complete, entirely binary 40-item set containing six fully present deficits. Its fraction would be 6/40, or 0.15. That invented example is not patient data, a diagnostic threshold, a probability or a prognosis. Real constructions can include intermediate item values. [2]
Item selection has two qualifications worth keeping together. Searle discusses population-level robustness across differing selections, while requiring the same items for serial measurements in the same individuals. Neither “every index is identical” nor “no indices can be compared” follows. The inspected paper did not specify a missing-item algorithm; this account does not borrow one from another instrument. [2]
A performance battery watches particular tasks
Guralnik and colleagues' original short physical performance battery combined standing balance, an eight-foot walk and five chair rises. Each domain received a score from zero to four, summed to a zero-to-twelve total. These are the historical protocol's tasks and scale; they should not be silently replaced with a modern walking distance or another scoring scheme. [3]
The cohort and the task sample are also different things. A report's headline assessment population does not mean every person completed every test. The original task denominators varied, so a reader should preserve the denominator attached to each analysis rather than assume one universal sample. [3]
A walking-speed result or a grip-strength result describes one task or component. It is not automatically the complete phenotype, a deficit index or the full battery. This comparison follows the instruments' definitions; it does not rank which tool is best. Different inputs answer different measurement questions. [1] [2] [3]
Nearby concepts do not collapse into one score
Disability and self-reported function overlap with physical frailty and performance assessment, but the original Fried and Guralnik discussions do not treat them as identical constructs. Recognizing overlap avoids two errors: counting every measure as independent evidence, or assuming one can substitute for another without checking. No percentage of overlap or individual prediction is claimed here. [1] [3]
Sarcopenia adds another distinction. The EWGSOP2 consensus combines strength with muscle quantity or quality for confirmation, while physical performance contributes to severity. A grip result alone is not that entire consensus definition. Its correction changes a muscle-mass threshold; no thresholds are reproduced here. This is an attributed definition, not a diagnostic recommendation. [4]
Molecular measurements ask another question again. Horvath's original DNA-methylation age predictor was built from molecular inputs, rather than the physical tasks or selected health deficits described above. That example is not a conversion between a frailty score and biological age, nor a statement about all clocks or commercial tests. The original paper has an erratum; cancer findings and effect estimates are outside this account. [1] [2] [3] [5]
Prediction is a different question from treatment benefit
A measure can be associated with later outcomes in an observational cohort. Showing that an intervention changes that measure, and showing that the intervention improves a meaningful outcome, require additional evidence. The three core reports do not by themselves establish that a treatment-induced score change extends lifespan. [1] [2] [3]
This is a limit on the inference, not a dismissal of frailty research or a claim that a frailty endpoint can never be useful. Read the outcome actually measured: a physical task, a composite score and survival are different observations. Then ask whether the study's design supports the conclusion being drawn. [1] [2] [3]
What to look for in the next report
Start with the instrument's name and version, then its inputs and protocol. Check the population, evaluable sample, missingness, comparison group, follow-up and measured outcome. Keep the paper's own question beside its result. These are reading questions, not a clinical assessment protocol. [1] [2] [3]
Funding, conflicts and limits
Fried acknowledges NHLBI support; Guralnik acknowledges NIA contracts. No modern conflict statement was identified for those historical reports, which does not establish absence of conflicts. Searle reports CIHR/Fountain support for secondary analysis and foundation/NIA funding for the original cohort. The authors declared no proprietary or financial conflict and no sponsor role in undertaking the analyses or submitting the paper. This is their historical, source-specific declaration. [1] [2] [3]
EWGSOP2 reports Abbott meeting/operating support and several authors' commercial relationships; its final disclosures govern. Horvath reports no specific funding and a University of California provisional patent naming the author as inventor. These disclosures do not rank instruments or settle their validity. [4] [5]
This educational account offers no self-test, treatment recommendation, risk calculator or score conversion.
Sources and editorial method
Three separately committed research passes preceded prose. A separate post-draft review checked the narrative against the frozen claims. A separate copy review checked the article, figure text and discovery descriptions against the frozen claims. A bounded 2026-11-02 source-status recheck retained both known corrections. See issue #210.
- Fried et al. (March 2001): physical phenotype
DOI 10.1093/gerona/56.3.M146 · PMID 11253156.
- Searle et al. (September 30, 2008): deficit construction
DOI 10.1186/1471-2318-8-24 · PMID 18826625.
- Guralnik et al. (March 1994): performance battery
DOI 10.1093/geronj/49.2.M85 · PMID 8126356.
- EWGSOP2: sarcopenia consensus
DOI 10.1093/ageing/afy169 · PMID 30312372.
Published correction / erratum; no diagnostic thresholds are reproduced here.
- Horvath: DNA-methylation age predictor
DOI 10.1186/gb-2013-14-10-r115 · PMID 24138928.
Published correction / erratum; no corrected thresholds or cancer effect estimates reproduced.
AI disclosure: AI-assisted research and drafting. Educational reporting, not medical advice.
Connected reading
Explore more evidence on health and independence
Keep the measurement in view
More on the outcomes that shape healthy aging
Read the pilot after identifying its measurement inputs
A four-week pectin pilot found signals—not proof of frailty benefit
In 31 older adults with frailty or pre-frailty, low-methoxy pectin did not change the inflammatory outcomes the paper defined as primary. Secondary and exploratory signals remain preliminary.
Evidence scopeHuman frailty/pre-frailty · small randomized four-week nutrition pilot
Compare the different outcomes used in healthspan reporting
A review found healthspan signals—and no common effect
Fifteen randomized studies measured intrinsic capacity, quality of life or other multidimensional scores. Their results could be described study by study—not combined into extra healthy years or a treatment ranking.
Evidence scopeHuman multidimensional function and well-being · systematic review of randomized trials