Evidence Explainer · Research literacy
Absolute risk shows what relative risk leaves out
“Twenty-five percent lower risk” can describe a large or a small change. The denominator, baseline risk, outcome, follow-up and uncertainty decide which.
Three research passes, frozen claim mapping, independent evidence review and release-time source/status rechecks are required before release.

By Lois Rune
Published October 2, 2026 · AI-assistance disclosure
Sources and record status verified October 2, 2026
Evidence at a glance
A reading method, tested against two real trials
- Study type
- Evergreen methods explainer using two large randomized human trials
- Studied in
- Different defined adult populations; the examples are not interchangeable
- Outcome type
- Cardiovascular composites, mortality and major hemorrhage
- Evidence maturity
- Peer-reviewed randomized outcome evidence plus authoritative methods guidance
- Conflicts / funding
- SPRINT was federally sponsored; ASPREE had public/institutional support and Bayer supplied study product in kind
- Our assessment
- Useful for reading reported results; not a calculator for personal benefit or harm
Read this first
Four checks before believing a percentage
- Ask “compared with what?” and find the event rate in both groups.
- Keep percent relative change separate from percentage-point absolute change.
- Carry the outcome, population and follow-up beside every number.
- Read the confidence interval and harms; a point estimate is not the whole result.
The bottom line
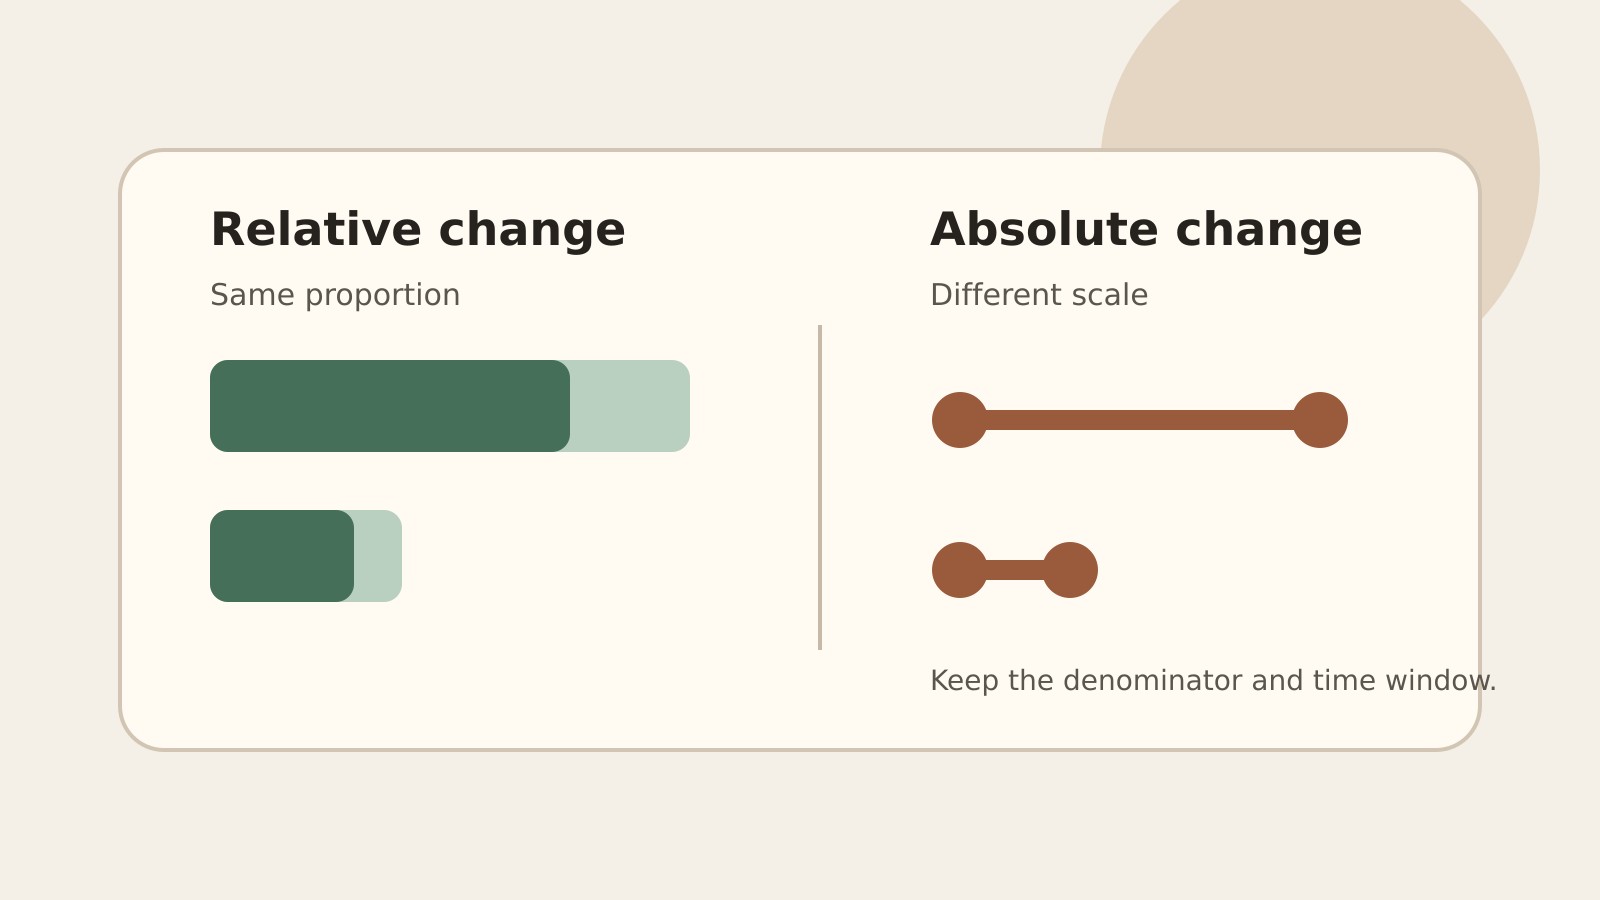
Relative effects answer a proportional question: how much larger or smaller was the reported risk or rate compared with the reference group? Absolute effects answer a scale question: how many percentage points, or how many events per stated denominator and time, separated the groups? Both can be correct. Neither is complete without the other.
A headline can make a modest absolute change sound dramatic by reporting only a large relative percentage. The reverse is possible too: a small relative change can matter when the baseline event rate is high. The useful reading habit is to reconstruct the two group numbers before interpreting the percentage.
Start with a fictional example
Imagine an intervention that produces the same fictional 25% relative reduction in two populations. If 20 of 100 people would have the event without it, a one-quarter reduction corresponds to 15 of 100: five fewer events per 100, or a 5-percentage-point absolute reduction. If 4 of 100 would have the event, the same relative reduction corresponds to 3 of 100: one fewer event per 100, or 1 percentage point.
The intervention did not become weaker in relative terms. The absolute effect changed because the starting risk changed. That is why applying a trial’s relative estimate to a person or population with a different baseline risk requires additional evidence and assumptions.
Percent is not percentage points
If an event falls from 20% to 15%, the absolute reduction is 5 percentage points. Relative to the starting 20%, the reduction is 25%. Saying “five percent lower” is ambiguous: it might mean five percentage points, or five percent of the starting value. Good reporting names the unit.
Counts can make the same comparison easier to see: 20 versus 15 events per 100 people over the stated period. But counts still need a time window and an outcome definition. Five fewer mild laboratory abnormalities is not interchangeable with five fewer deaths.
Rates are not cumulative risks
Trials often report events per person-year because participants are followed for different amounts of time. A rate of 10 events per 1,000 person-years is not the same statement as 1% of participants having an event. A single person can contribute part or all of a person-year, follow-up varies, and some outcomes can recur.
Do not multiply a person-year rate by the average follow-up and call the result a cumulative risk unless the study provides a valid method for that conversion. This explainer keeps SPRINT’s annualized percentages and ASPREE’s events per 1,000 person-years exactly on their reported scales.
What the trial examples show
| Trial and outcome | Reported groups | Model estimate | What can be said |
|---|---|---|---|
| SPRINT Primary cardiovascular composite in 9,361 higher-risk adults without diabetes or prior stroke | 1.77%/year intensive vs 2.40%/year standard; median follow-up 3.33 years | HR 0.73 95% CI 0.63–0.86 | Arithmetic difference: 0.63 percentage points per year; reported-rate ratio implies about 26% lower, while the time-to-event model reported HR 0.73. |
| ASPREE Cardiovascular composite in 19,114 selected older primary-prevention adults | 10.7 vs 11.3 per 1,000 person-years; median follow-up 4.7 years | HR 0.95 95% CI 0.83–1.08 | The trial did not demonstrate a significant reduction; the interval does not prove identical effects. |
| ASPREE Major hemorrhage in the same trial | 8.6 vs 6.2 per 1,000 person-years | HR 1.38 95% CI 1.18–1.62 | Arithmetic difference: 2.4 additional events per 1,000 person-years; proportional rate increase about 39%. No cumulative-risk or NNH conversion. |
The table is not a treatment ranking. SPRINT and ASPREE tested different interventions, populations, outcomes and follow-up. Their rows teach reading, not which treatment is “better.”
A hazard ratio is not automatically a risk ratio
Both trials used time-to-event analyses. A hazard ratio compares the event hazard between groups across follow-up under a statistical model. It uses when events occurred and how long people remained under observation. A risk ratio usually compares cumulative proportions by a specified time.
Those quantities can look similar when events are uncommon and modeling assumptions fit, but they are not definitions of the same number. Subtracting a hazard ratio from one does not yield an absolute risk reduction. Converting an HR into a number needed to treat requires a baseline survival estimate, a time point and assumptions that this page does not supply.
Uncertainty belongs beside the estimate
A 95% confidence interval shows statistical uncertainty around the estimate under the analysis. Narrower intervals are more precise; wider intervals leave more effects compatible with the data. When an interval for a ratio includes 1, the study has not demonstrated a difference at the conventional threshold. That is not proof that the true effects are identical.
Precision is only one part of certainty. Eligibility, adherence, measurement, early stopping, missing data, endpoint choice and applicability can matter even when an interval is narrow. SPRINT’s selective population and intensive measurement protocol limit transfer. ASPREE’s result applies to initiation for primary prevention in selected older adults, not to every aspirin indication.
Benefits and harms need separate rows
SPRINT’s cardiovascular benefit came with more serious hypotension, electrolyte abnormalities, acute kidney injury or failure and syncope. ASPREE measured a cardiovascular composite and major hemorrhage in the same participants; its bleeding increase must not disappear behind a cardiovascular headline.
Do not subtract unlike outcomes into an invented net score. People value outcomes differently, and trial definitions differ. Report each benefit and harm with its own denominator, time, uncertainty and clinical meaning.
What this explainer does not show
It does not calculate a personal baseline risk, recommend a blood-pressure target, or tell anyone to start, stop or change aspirin or another medicine. It does not establish that SPRINT slowed aging or that ASPREE settles secondary prevention. It also avoids a number needed to treat or harm because the necessary cumulative-risk time point is not supplied consistently across these examples.
Practical rule: When a headline gives one percentage, look for two group numbers, the outcome, the denominator, the time window and the confidence interval. If any are missing, the headline is not enough for a decision.
Primary and methods sources
Sources, roles and limits
- Final report of SPRINT
- Identifier
- PMID:34010531 · PMCID:PMC9907774 · DOI:10.1056/NEJMoa1901281 · NCT01206062
- Role
- Randomized cardiovascular, mortality and serious-adverse-event example
- Limitation
- Defined higher-risk population and protocol; not a personal target or aging trial.
- ASPREE cardiovascular events and bleeding analysis
- Identifier
- PMID:30221597 · PMCID:PMC6289056 · DOI:10.1056/NEJMoa1805819 · NCT01038583
- Role
- Randomized primary-prevention cardiovascular and major-hemorrhage examples
- Limitation
- Selected older population; does not address secondary prevention.
- Cochrane Handbook, Chapter 15
- Identifier
- Version 6.5, 2024; chapter updated August 2023
- Role
- Authoritative guidance on relative and absolute effects, confidence intervals and baseline risk
- Limitation
- Methods guidance does not replace each trial’s report.
- SPRINT registry and ASPREE registry
- Role
- Exact trial identity, eligibility and status context
- Limitation
- Registrations are not treatment recommendations.
Connected evidence
Read the full trial stories and records
Read the trial outcomes behind the examples
These links are editorially selected reading paths, not evidence that the stories support one another or recommendations about what to do.
Read the full SPRINT outcome story behind the worked example
SPRINT reduced cardiovascular events—not aging itself
Intensive treatment lowered cardiovascular events and mortality in eligible high-risk adults, with more hypotension, electrolyte problems and kidney injury.
Evidence scopeHuman clinical outcomes · large randomized trial
Read the full ASPREE benefit-and-harm story behind the worked example
ASPREE did not lower cardiovascular events—and increased major bleeding
In selected older adults without cardiovascular disease, low-dose aspirin did not significantly reduce the trial’s cardiovascular composite. Major hemorrhage occurred more often.
Evidence scopeHuman cardiovascular and safety outcomes · large randomized trial
Disclosures and history
- October 2, 2026 — discovery/scope, full-source/status/counterevidence/disclosure review and frozen atomic claim mapping completed before prose.
- October 2, 2026 — arithmetic checked independently against reported group rates; no HR-to-risk, person-time-to-cumulative-risk or NNT conversion used.
- Corrections: no linked correction, expression of concern or retraction identified for the two featured final reports at verification. SPRINT’s earlier baseline-table erratum did not change outcomes.